|
 Several years ago, Wedelich Consulting accepted a project
to enhance an existing program that provided graphs of financial data.
The application was being converted from distributed dBase files to
a central Oracle database. After completion, a second project
began to provide additional plots of
production and downtime data, with an emphasis on comparing results. The approach was to
restructure the original program to a multi-window application
designed to handle multiple presentation formats from multiple data
sources. Several years ago, Wedelich Consulting accepted a project
to enhance an existing program that provided graphs of financial data.
The application was being converted from distributed dBase files to
a central Oracle database. After completion, a second project
began to provide additional plots of
production and downtime data, with an emphasis on comparing results. The approach was to
restructure the original program to a multi-window application
designed to handle multiple presentation formats from multiple data
sources.
A few years later, Wedelich Consulting accepted a project
with another company to develop a similar decision support graphics
tool with four different information sources and several presentation
types.
Visual Basic had evolved to include classes and abstract interfaces,
and to allow custom control development. The approach was to develop
an application framework that operated on a collection of presentation
themes.
This topic presents the user objectives for the decision support system
along with screen shots to illustrate the solution. The
software
architecture objectives are also discussed.
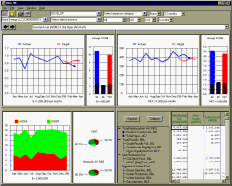
User Objectives
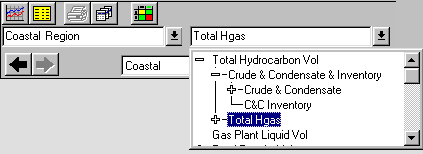
Quick Access - The system must provide easy and quick access to
graphs. A custom toolbar is used for each presentation type with
drop down outline lists to select business location, cost category, and
other input choices. The picture below shows the toolbar buttons
and selection controls for one theme. The user selects a business location and a
category and then clicks the graph button to activate a graph
presentation of that data. Drop down outlines are used for
location and category selection.
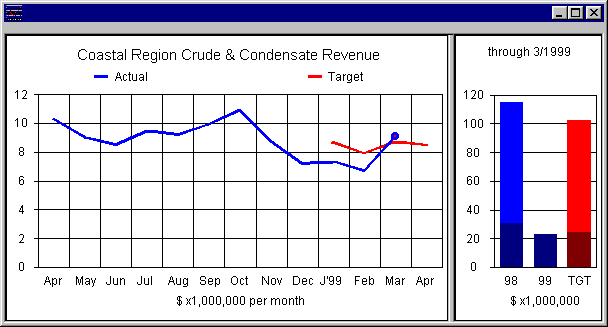
Presentation Provides an Answer - The presentation of data
includes both a detail and summary view that is designed to address a
common business question or need. The picture below shows the
presentation for financial data. The graph on the left shows
the revenue trend and includes a comparison with the current year
target. The summary graph on the right shows the prior year total
with the darker blue showing the prior year thru March for easy
comparison with current YTD. The target also uses a darker color
to show both YTD and total target for the current year.
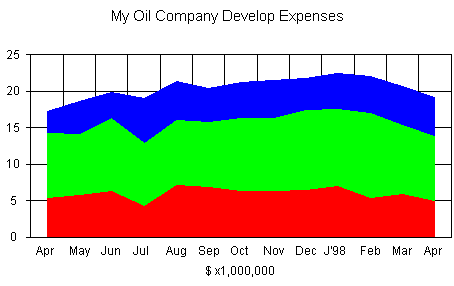
The plot formats vary for the different data sources. Another
useful format is an area plot that
shows both total expense and the breakdown of that expense by either sub
expense categories or by child locations.
Help Find Issues - The variation
matrix theme is a valuable tool to help find potential business issues
where actual data varies significantly from targets. An outline
grid control (derived from an outline control and a grid control) is
used to view a set of cost categories for a set of locations.
Clicking on the plus sign expands the category list and grid to show
additional data.
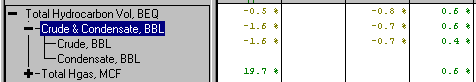
Columns in the grid represent locations, with a parent location in the
first column and child locations in the remaining columns.
Selection choices allow display of actual values, target values,
variance value, or variance percent. A double click on a cell
displays the financial trend graph for that location and cost category.
Automate Reporting - The forward and back arrows belo w the
selection lists on the toolbar implement a history feature. Each
new theme request generates a new item in the history list, and prior
graphs can be easily recalled by selecting from the history list.
In addition, a batch group feature exists to add a set of graph requests
to a named group. The group can be recalled at a later time after closing a
month to quickly browse through a set of desired presentations. w the
selection lists on the toolbar implement a history feature. Each
new theme request generates a new item in the history list, and prior
graphs can be easily recalled by selecting from the history list.
In addition, a batch group feature exists to add a set of graph requests
to a named group. The group can be recalled at a later time after closing a
month to quickly browse through a set of desired presentations.
Software Architecture Objectives
The decision support application framework must allow addition of
new themes with only minor changes to the framework. An object
oriented design is key to providing this extensibility. The
framework must have standard interfaces to create a new window for a theme
and update the theme's contents. In addition, the selection items
for the theme must conform to an object oriented structure so that
features like the history bar and batch groups do not require modification
for a new theme.
Other objectives include use of database tables for
pick list contents that will change, especially the location and category
lists. A three tier architecture is used with the middle tier
providing the data. This layer collects code that depends on the
database structure, and it also allows the middle tier to be used by other
applications that need access to the same type of data.
The system was developed in stages - the financial
themes were deployed first, and then new themes were added with only minor
modifications to the framework. This decision support application
has been in production for more than four years, and has required
virtually no maintenance.
| 